Selected projects in archaeological documentation, digital methods, and research visualisation.
Digital Methods
My archaeological work has gradually led me toward digital and computational methods.
Alongside GIS, photogrammetry, 3D visualisation, and CAD drawing, I have begun developing
basic Python workflows for research data exploration, statistical graphics, and reproducible
visual outputs.
These projects are not presented as software engineering work, but as practical research tools:
transforming bibliographic metadata, archaeological field records, or measured section data
into readable graphics that can support historical and archaeological interpretation.
Bibliographic data mining for African studies
As part of research assistance for an external African studies project, I experimented with Python
workflows for exploring CNRS-related bibliographic metadata on HAL. The aim was to structure
a preliminary corpus and produce visual summaries that could help identify chronological
trends, thematic categories, and regional distributions.
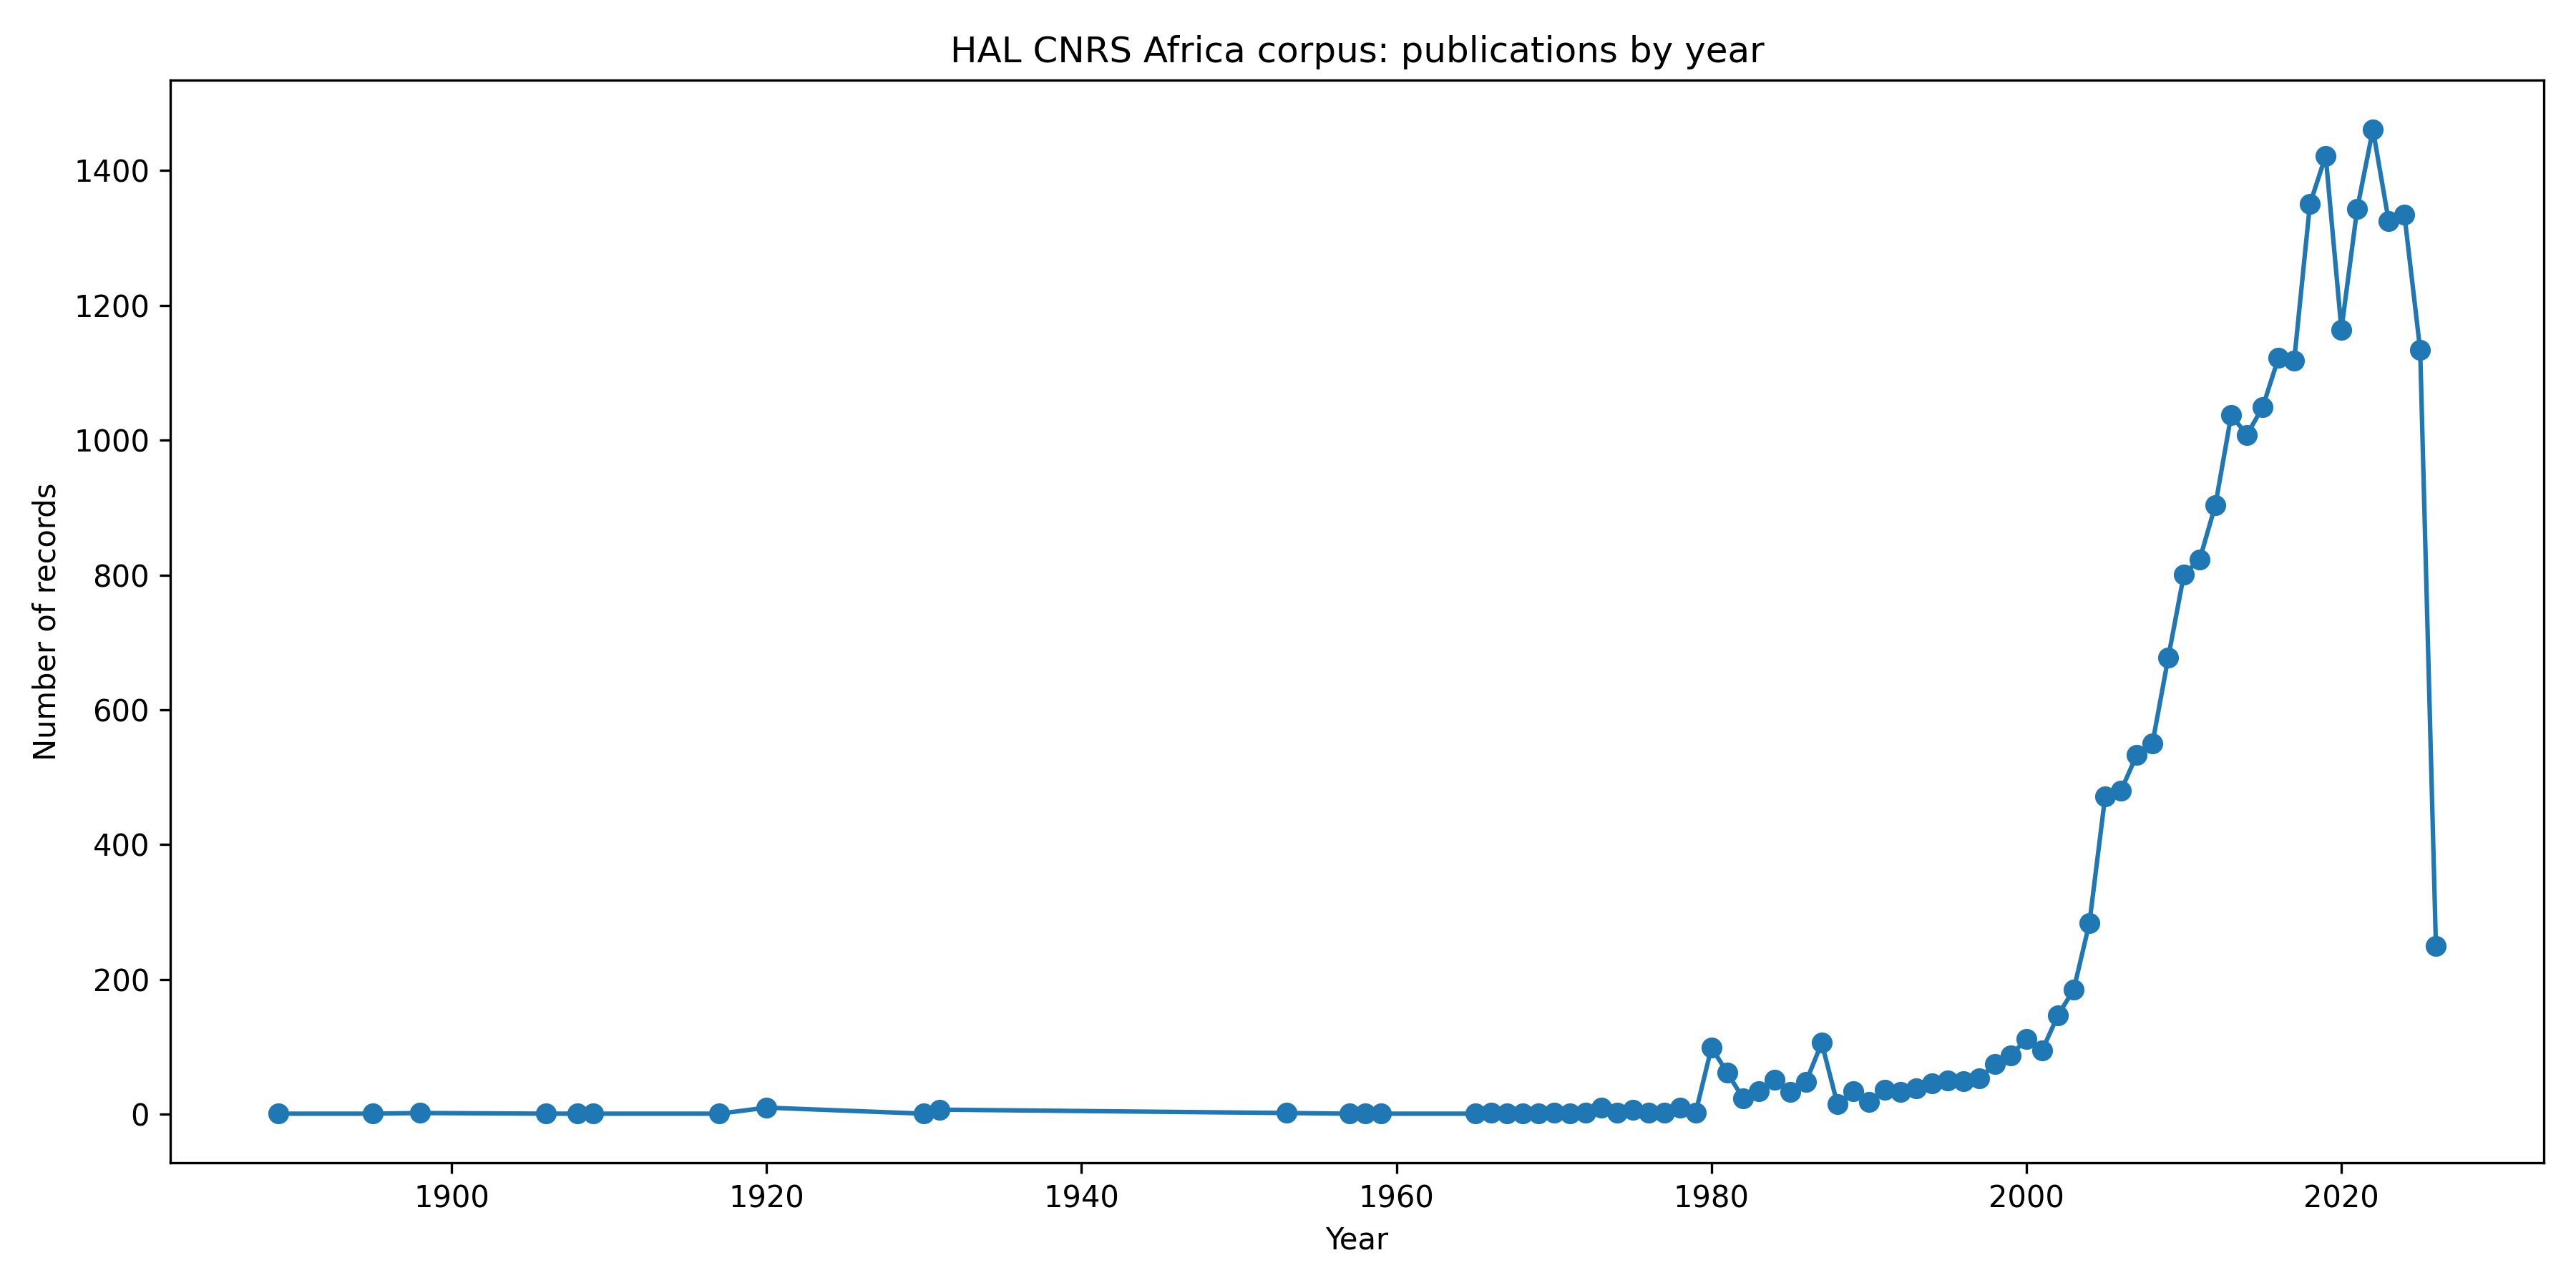
Publications by year in the Africa corpus. Graph generated from cleaned bibliographic metadata
to visualise the chronological growth of the corpus over time.
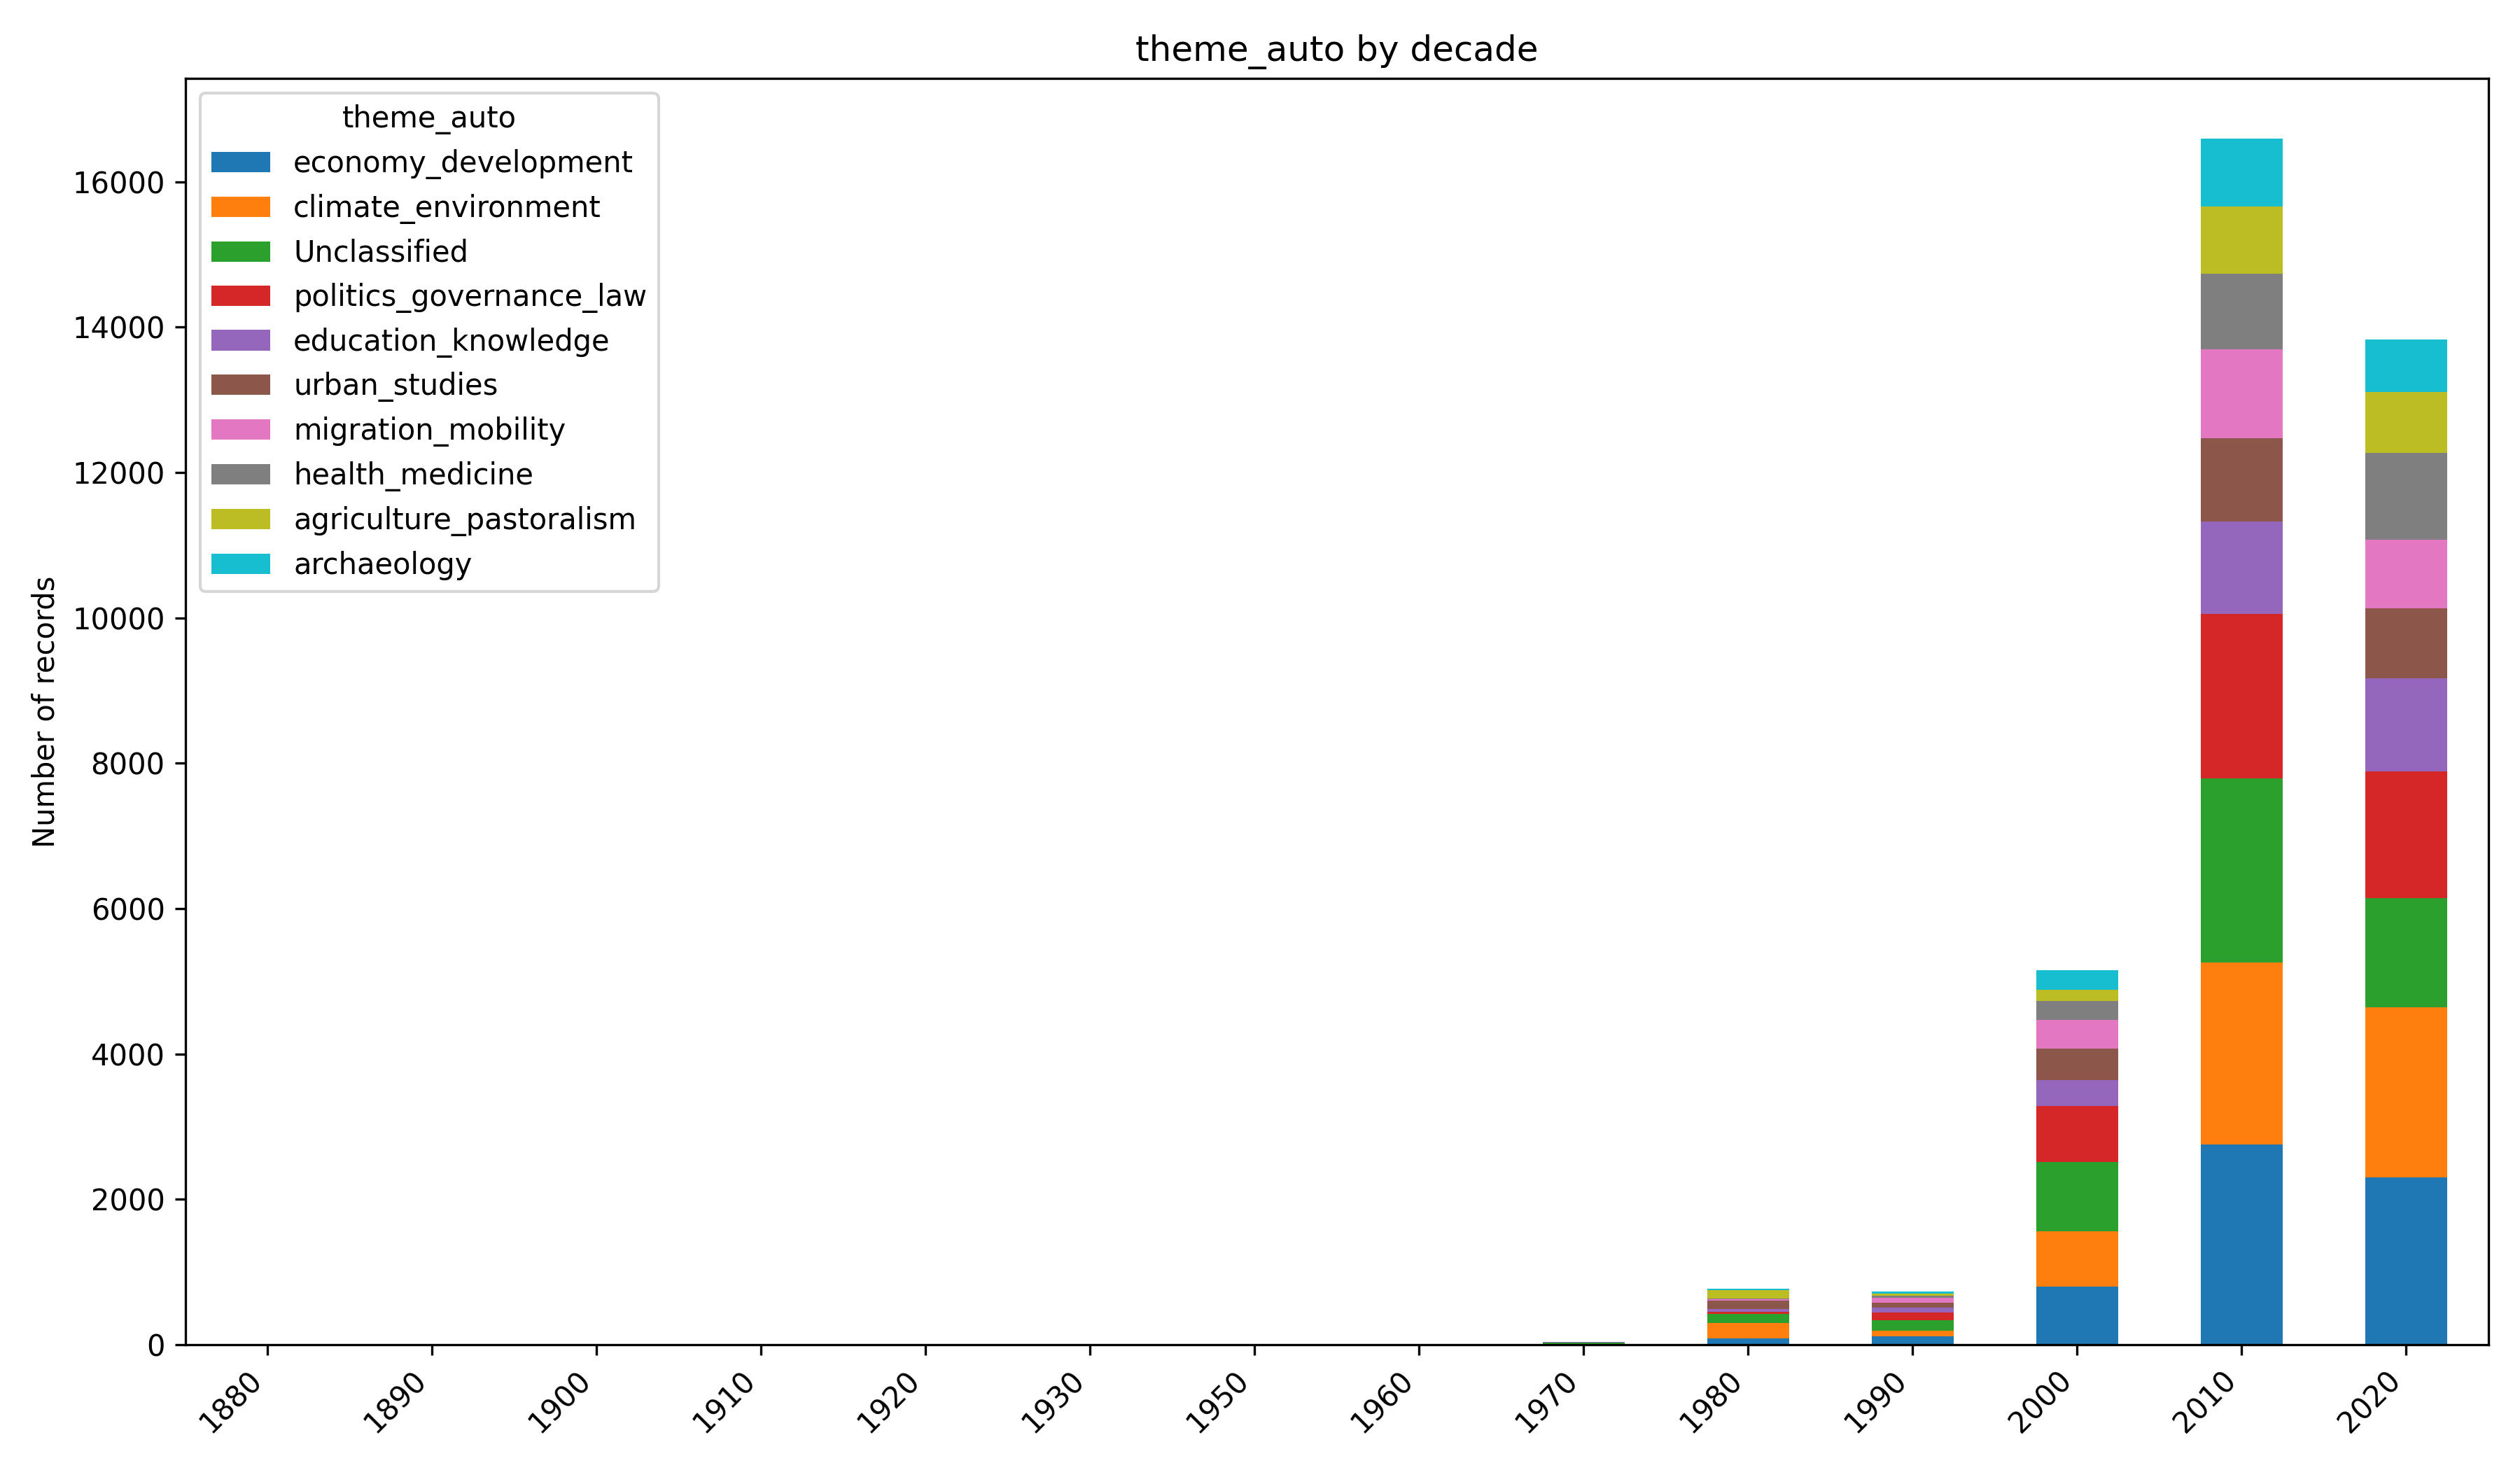
Thematic distribution of the corpus by decade. Stacked bar chart used to compare the changing
weight of broad research themes across decades.
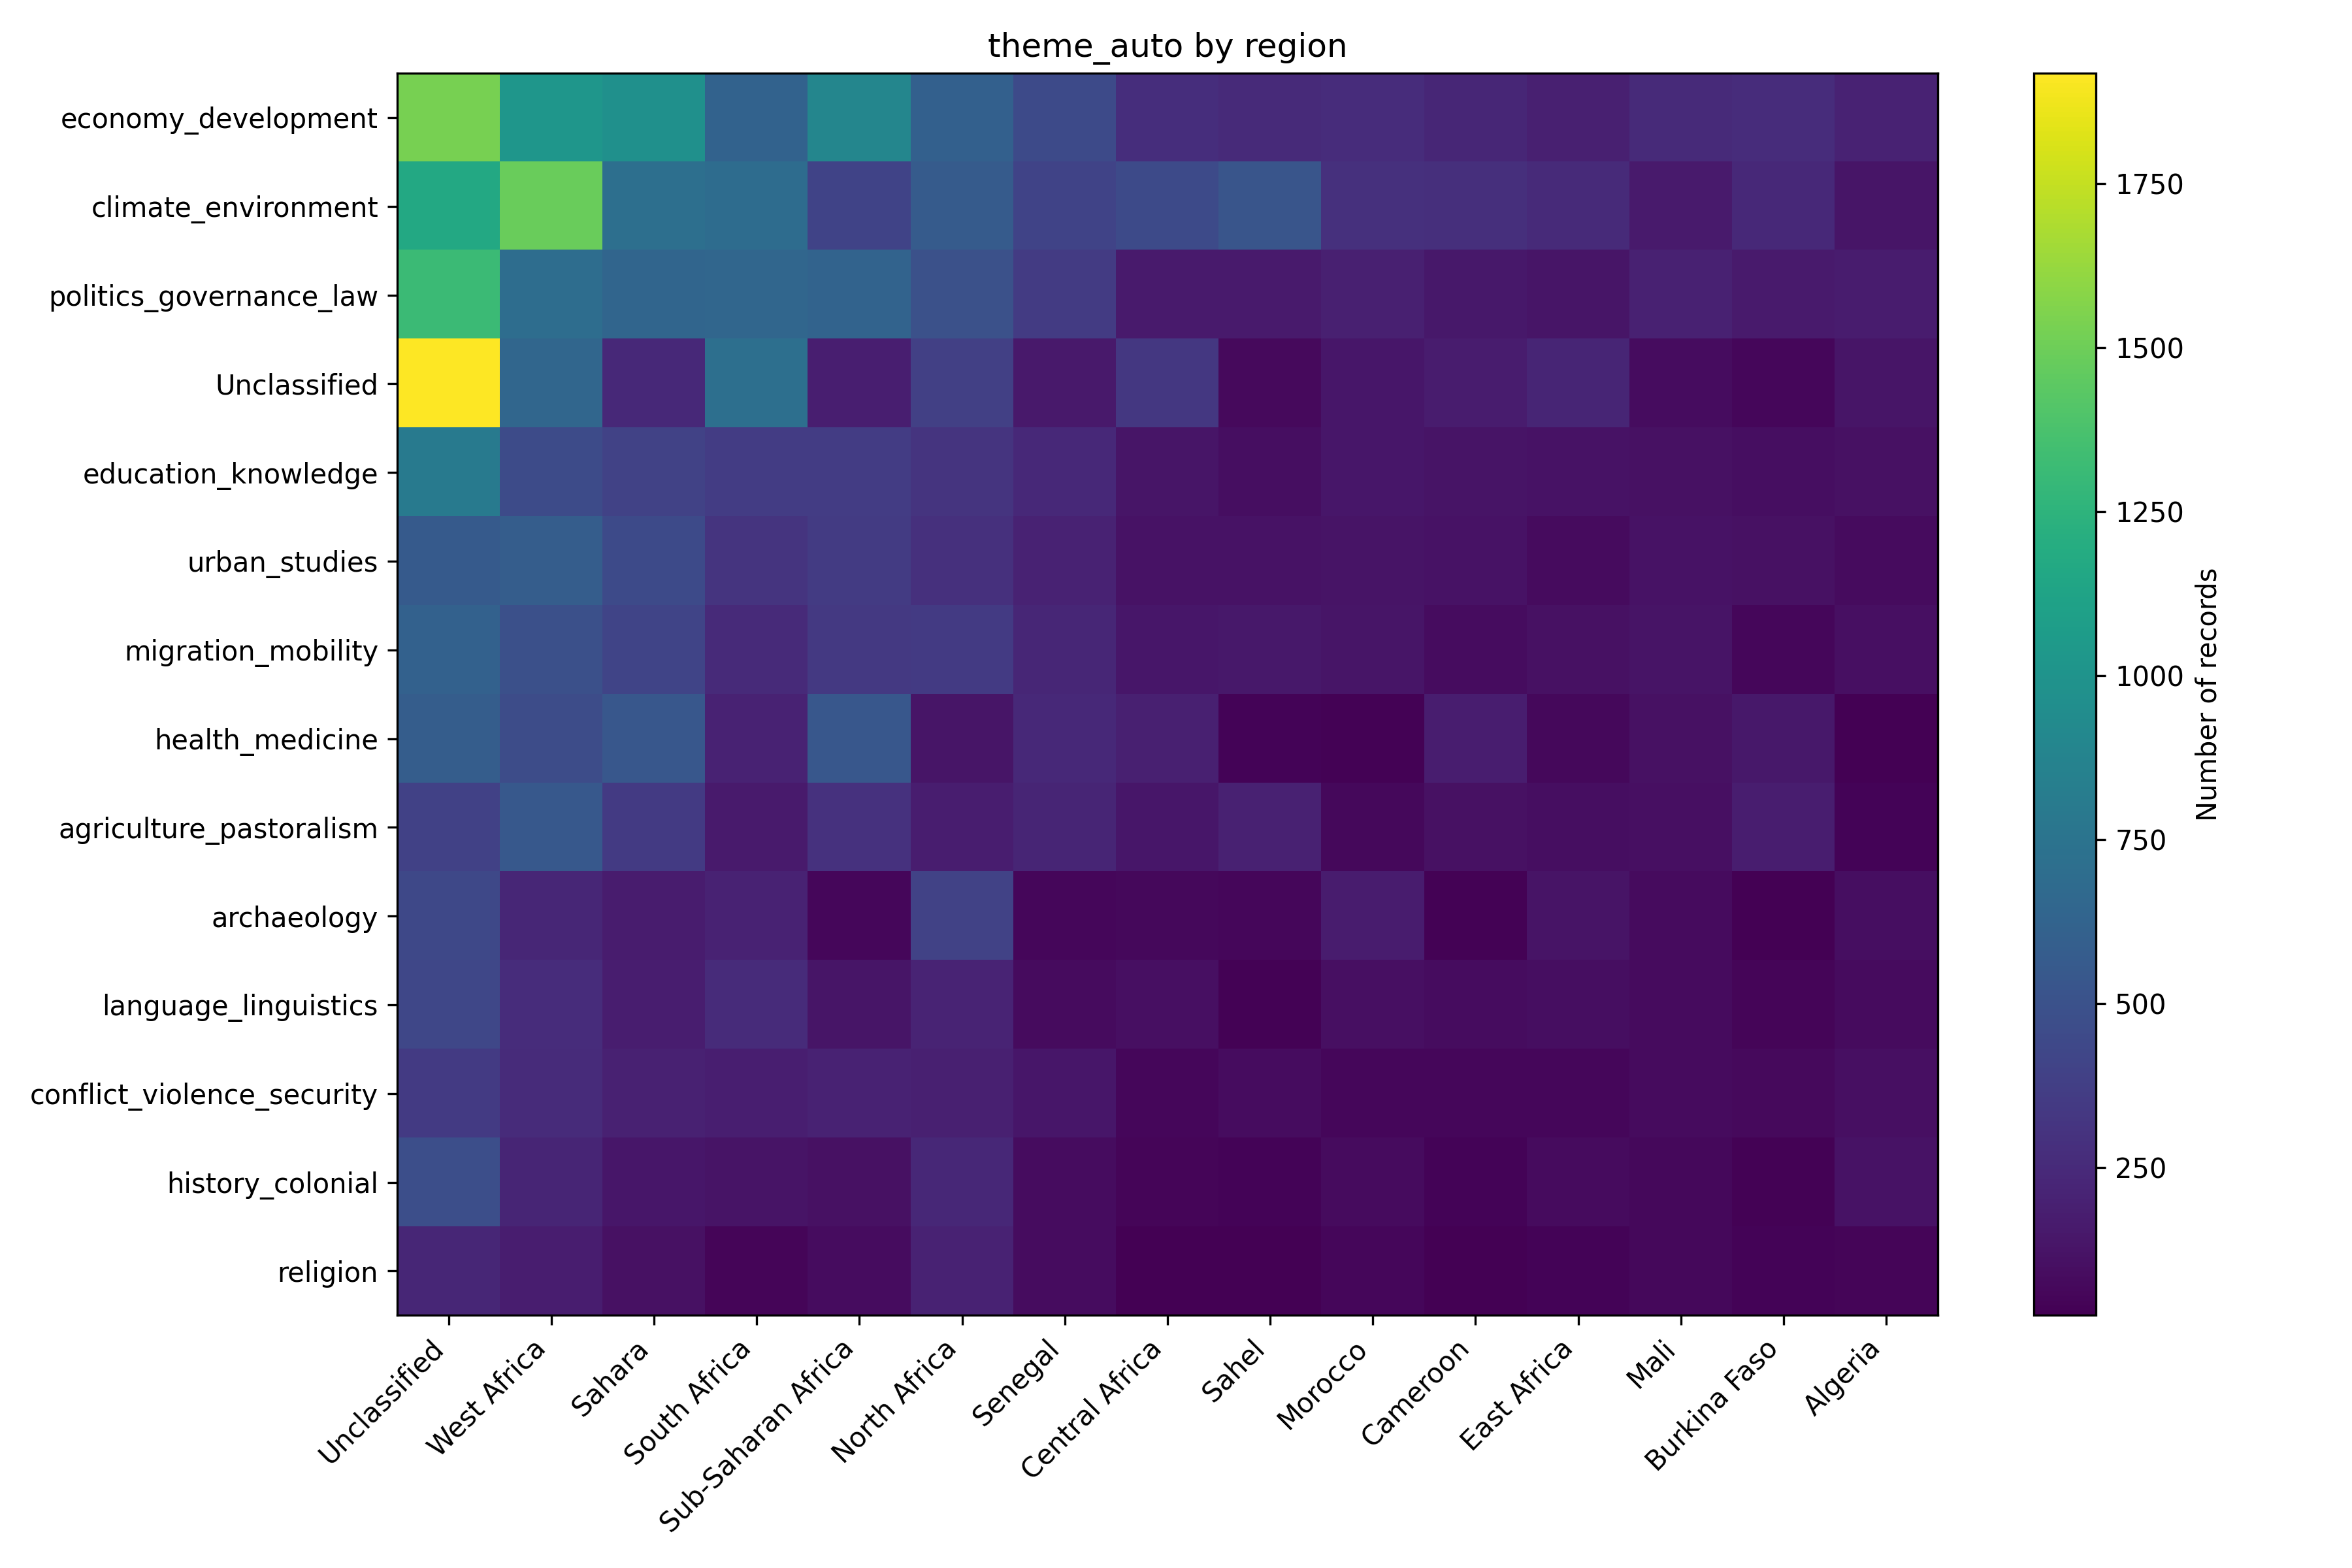
Thematic categories by region. Heatmap comparing research themes across regional categories,
offering a synthetic view of topic distribution within the corpus.
Statistical graphics for archaeological interpretation
During my master's research on the burned abandonment layer of a structure at a southern Italian site,
I used Python to generate statistical graphics from archaeological field records. These figures
supported the comparison of artefact categories, altimetric distributions, and differences between
the eastern and western sectors of the structure.
Methods such as boxplots, standard deviation, and sliding-window counts helped test observations
and make interpretative arguments more explicit. The aim was not to automate archaeological
interpretation, but to use simple quantitative tools to clarify patterns within a complex field dataset.
Methods: boxplots · standard deviation · sliding-window counts · category comparison · altitude distribution · exploratory graphics
Tools: Python · pandas · matplotlib · archaeological field records · 3D coordinates
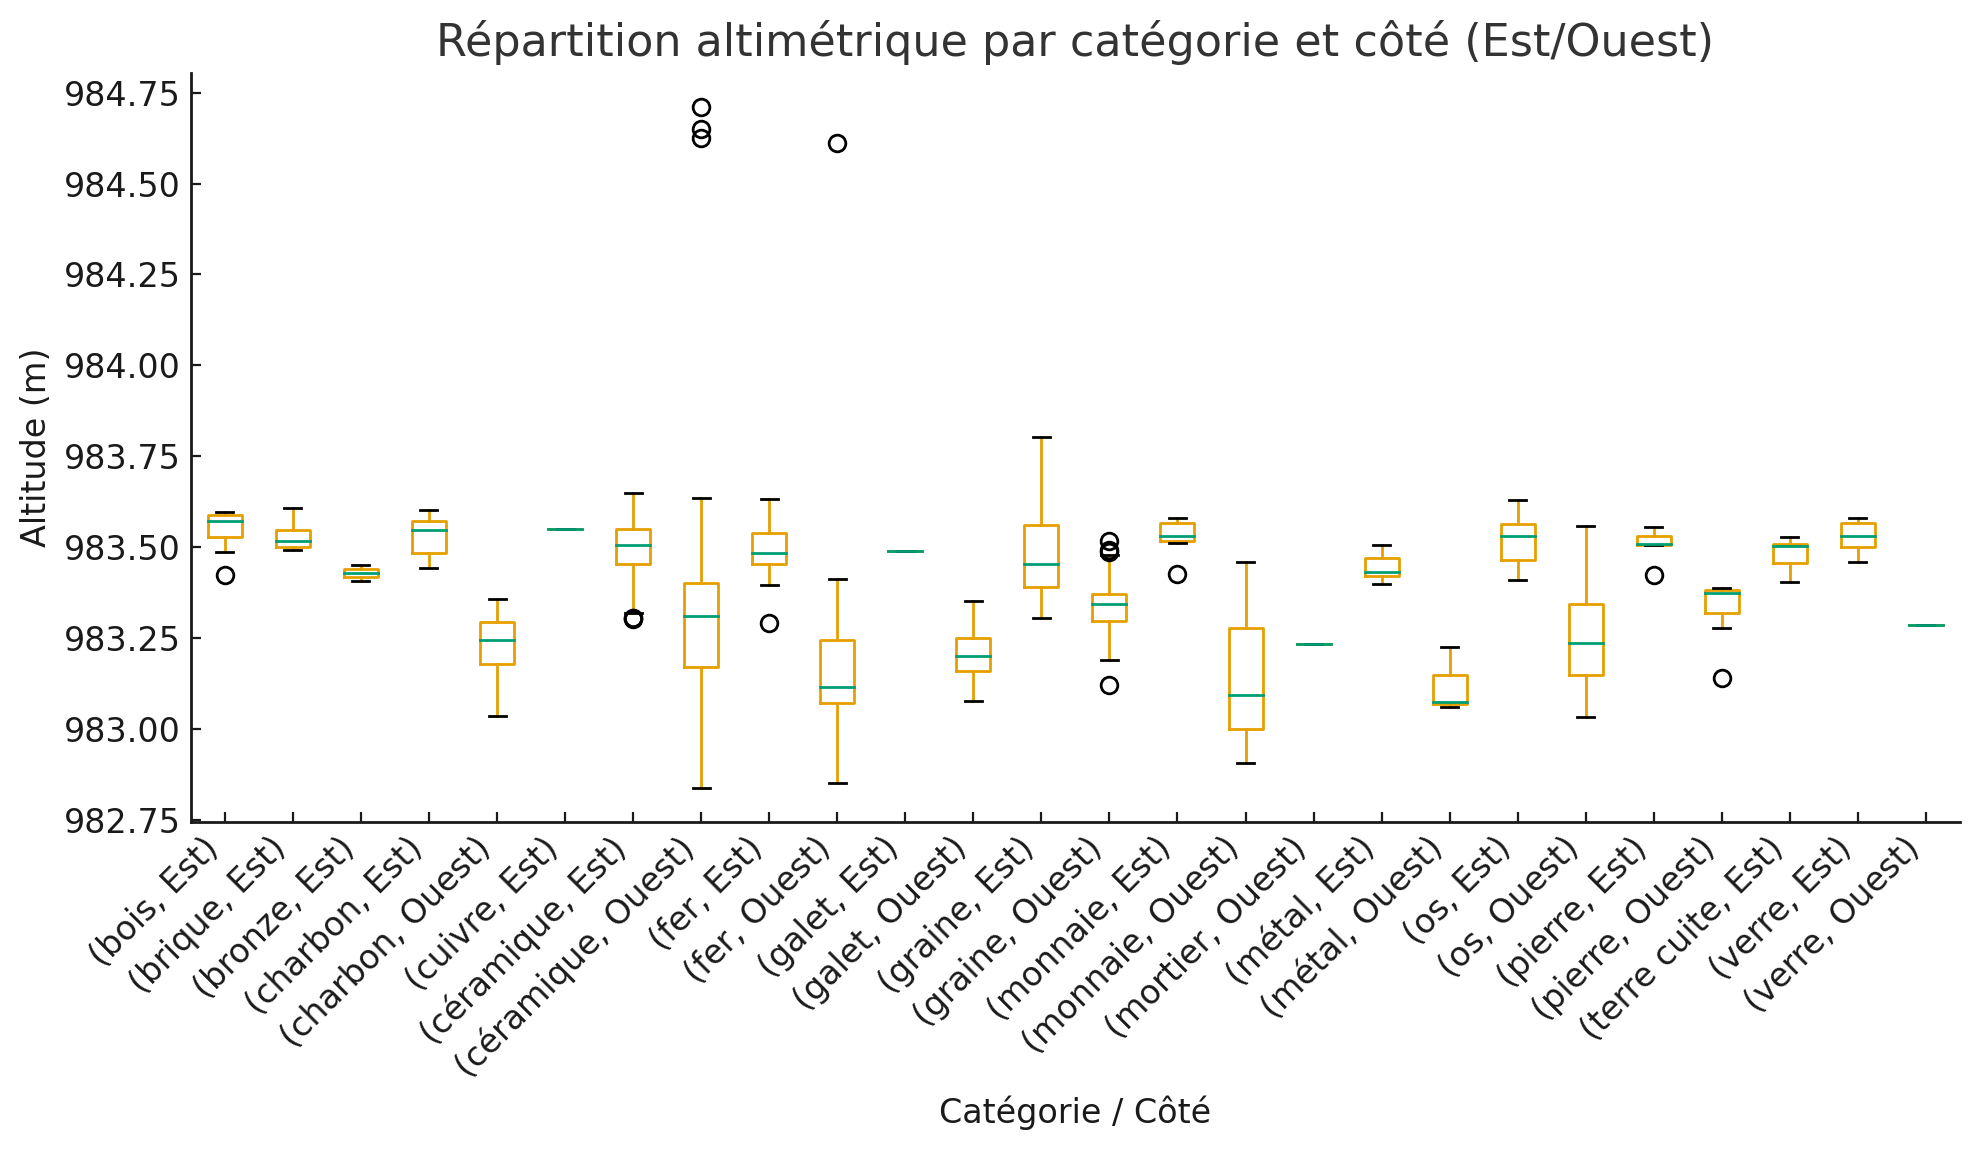
Vertical distribution of finds by category and sector. Python-generated boxplot comparing find
altitudes according to material category and eastern/western sector.
From field measurements to section drawing
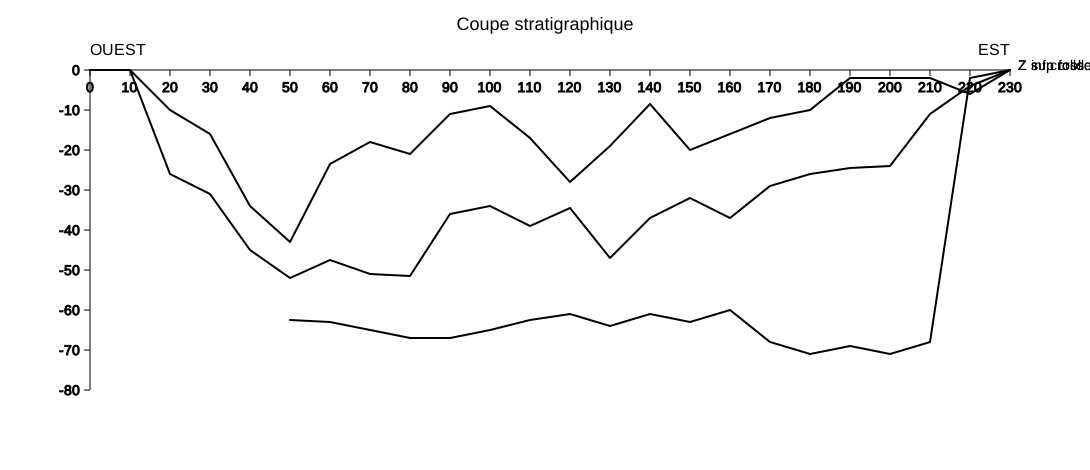
This small workflow was developed to transform measured CSV data from an archaeological section
into a scaled visual base. Python was used to read the coordinates, generate axes, place layer
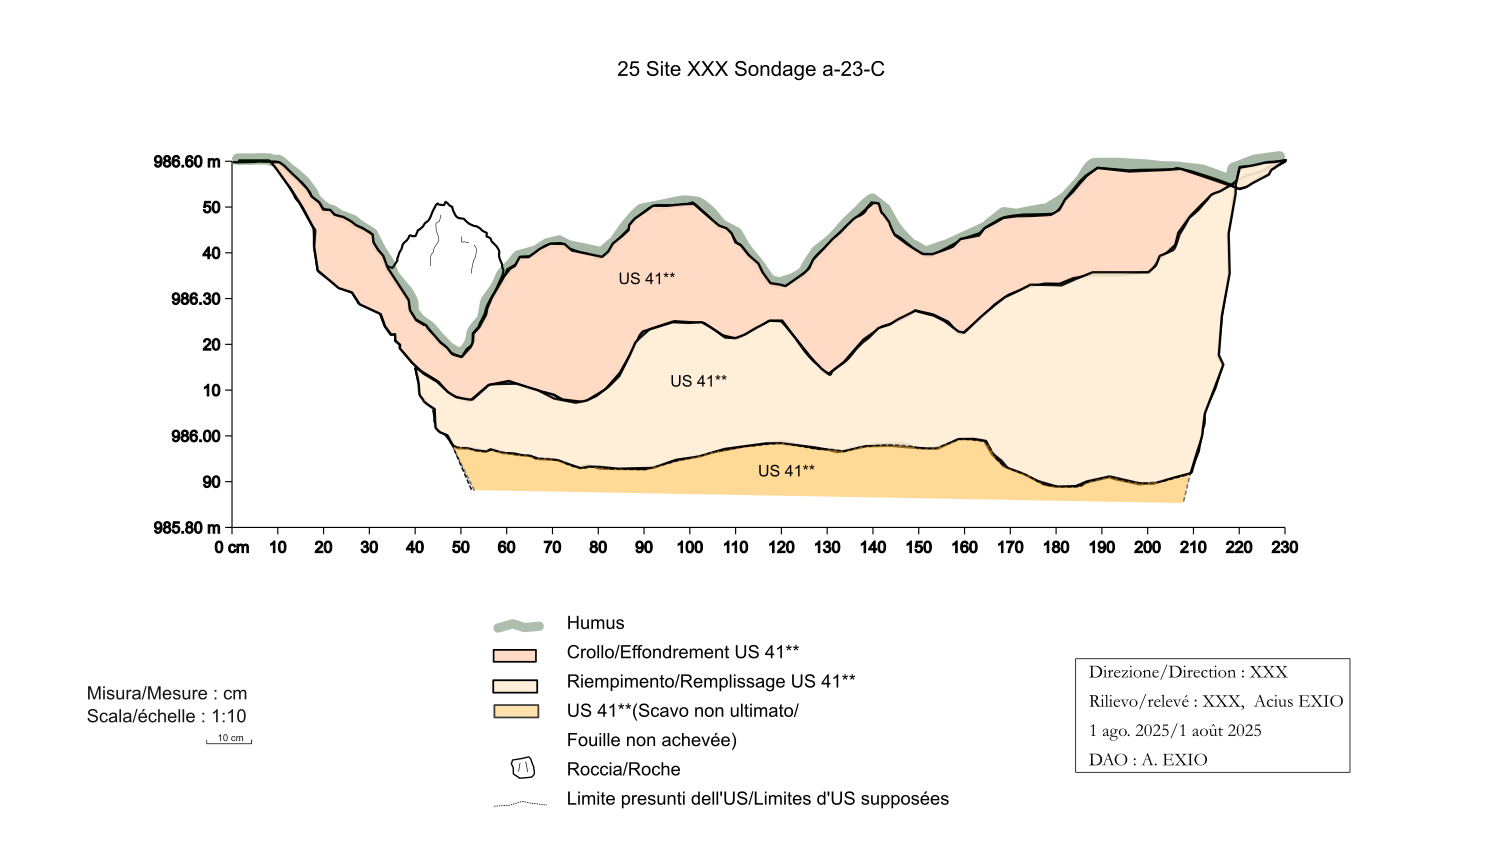
boundaries, and produce a first technical drawing. The resulting SVG was then refined manually
in Inkscape according to archaeological drawing conventions.
The aim was not to replace manual archaeological drawing, but to make the first stage of section
plotting more reproducible: the geometry, scale, axes, and coordinates are generated from structured
data rather than redrawn by eye.
Python-generated base section. First SVG output generated from CSV measurements, with controlled
axes, scale, and layer boundaries.
Final archaeological section drawing. Refined CAD version produced in Inkscape from the
Python-generated base, with improved graphic conventions, labels, and visual hierarchy.